


The SWD interface does not only consist of the SWDIO and SWDCK lines, but also has optional signals used in more specific cases. In this post, we will present the SWO and nRST signals.
SWO – The debugging trace output
Developers often use logging functions to help them trace the execution of their programs. Unfortunately, this is more difficult on embedded devices, as there is sometimes no way to make these messages available to the developer. ARM provides some nice improvements to the classical debugging tools based on the ITM (Instrumentation Trace Macrocell) present in many of the Cortex cores. This component allows a programmer to use printf like statements to help the debugging process.
In the most common case, the programmer can instruct the ITM to send a message through the ITM_SendChar()function. This function is available through the CMSIS HAL and is common to all Cortex-based MCUs. The ITM will forward the message to the TPIU (Trace Port Interface Unit) that is responsible to transfer it to its final destination. The TPIU will format the message, add some header information and push it to its final destination.
This destination is most of the times the SWO (Serial Wire Output) interface, a single wire paired with the SWD interface and used to transmit trace messages to an external debugger. This interface can be configured in two different modes : Manchester or UART encoding (see here).
As an example, here is a simple application based on a STM32F405. This application configures the SWO pin, and sends a message through the SWO pin :
// Includes omitted for clarity

void print_swo(const char *data, const uint32_t size)
{
    uint32_t i;
    for(i = 0; i<size; i++)
        ITM_SendChar(data[i]); /* core_cm4.h */
    }
}

void main(void)
{
    GPIO_InitTypeDef gpio_init;

    /* GPIO pin configuration, PB3 is the SWO on this chip */
    gpio_init.Mode = GPIO_MODE_AF_PP;
    gpio_init.Pin = 1 << 3;
    gpio_init.Speed = GPIO_SPEED_HIGH;
    gpio_init.Pull = GPIO_NOPULL;
    gpio_init.Alternate = GPIO_AF0_TRACE;
    HAL_GPIO_Init(GPIOB, &gpio_init);

    while(1) {
        print_swo("Hello", 5);
    }
}
In order to see the messages, we need to enable the ITM macrocell as well as the TPIU. For that, we can either set the registers by hand (see the registers list here) or use openOCD to enable the TPIU when debugging. In the example below, we’re telling openOCD that our target runs at 168MHz, and that we want an UART-encoded SWO at 2Mb/s.
$ telnet 127.0.0.1 4444
Trying 127.0.0.1...
Connected to 127.0.0.1.
Escape character is '^]'.
Open On-Chip Debugger
> help tpiu
  stm32f4x.cpu tpiu
        tpiu command group (command valid any time)
    stm32f4x.cpu tpiu config (disable | ((external | internal <filename>) (sync <port width> |
              ((manchester | uart) <formatter enable>)) <TRACECLKIN freq>
              [<trace freq>]))
> tpiu config external uart off 168000000 2000000
> itm ports on
> reset run
HelloHelloHello[...]
Then, looking at the logic analyzer trace :
The TPIU can also be used by the ETM, the tracing macrocell. When in use, the ETM will send periodic messages showing the full execution trace. This trace however does just contain information about the number of instructions executed, and if branches are taken or not. This cannot be used as a way to dump the actual instructions.
Semihosting
There is another option that can be used to send messages to the debugger, namely the semihosting. This mode takes advantage of a specific service request (interrupt) to ask the debugger to take action.
Technically, a compatible debugger must trap service requests numbers 0x123456 in ARM mode, or 0xAB in thumb mode. Once the debugger is triggered, it will read the operation number in r0, and a pointer to the arguments in r1 by using standard MEM-AP queries. It will then parse the arguments, complete the operation, change the pc value to point to the next instruction and resume the core execution.
As an example, the C code below uses the SYS_WRITE operation to write to the host’s debugger STDOUT, similar to a print() :
print_semihosting(char * data, size)
{
    uint32_t args[3];
    args[0] = 1;
    args[1] = (uint32_t)data;
    args[2] = size;
    asm(  "mov r0, #5\n"
          "mov r1, %0\n"
          "bkpt 0x00AB" : : "r"(args) : "r0", "r1");
}
void main(void)
{
    while(1) {
        print_semihosting("Hello", 5);
    }
}
Running the code from within a openOCD, the string is displayed directly inside of the session :
$ telnet 127.0.0.1 4444
Trying 127.0.0.1...
Connected to 127.0.0.1.
Escape character is '^]'.
Open On-Chip Debugger
> arm semihosting enable
> reset run
HelloHelloHello[...]
This feature is really interesting, and provides nice ways to transfer test data from and to the device for testing purposes.
nRST : Not just a reset signal
While testing a new chip (The STM32L011D3), I had some trouble connecting to it using the standard SWD interface. The SWD interface was not able to communicate with the debug port. Digging through the datasheet, I found out that this chip has to be programmed using the “connect under reset” method.
Connect under reset ?
On smaller (read: low pin count) devices, the SWD DP is not mapped to GPIOs at boot time but can be enabled by software afterwards. However, we have a chicked and egg problem here. To avoid this, engineers added the connect-under-reset feature, where the SWD pins are mapped to the DP when the chip is under reset condition. There is usually a dedicated pin for the reset, most of the times labelled nRST.
In order to connect to the DP, the debugging interface must pull the nRST low, then issue the JTAG->SWD switch command.
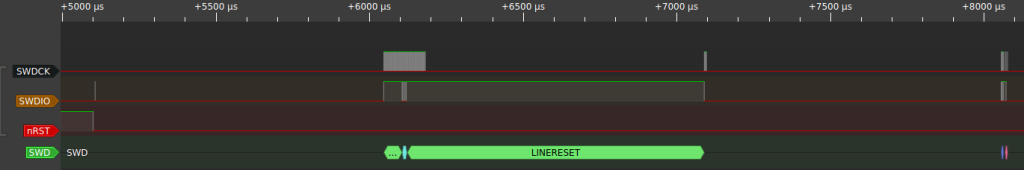
A J-Link interface is able to handle such a chip, and it was just a matter of connecting the nRST pin of the chip to the RESET pin of the J-Link. The same is possible using an official ST-Link interface as well.
Conclusion
In this short article, we presented two additional signals often used along with the SWD interface, as well as some common usages. The SWO pin can sometimes be useful if it is still used by the firmware of an embedded device, and can help reverse-engineer it.
Bonus: Adding nRST and SWO to an ST-Link clone
If you are using one of those cheap ST-Link clones you can buy online, you’re out of luck because the nRST pin is not present on the exposed header. But since this clone runs the same firmware as an official ST-Link, it is possible to change a pin function by connecting it to somewhere else on the PCB. Since the RESET pin is used to program STM8 devices, I decided to repurpose it as nRST.
Looking at the St-Link v2 schematics, we can see that we need to connect the T_NRST signal to our pin. This signal comes from the GPIO named PB0, located on pin number 18 on the chip. We also have to make sure that we add a 22 Ohm impedance matching resistor like on the original design (see R13 on the schema). Taking a closer look at our PCB, we can see that the RESET pin is connected to a 100 Ohm resistor on the opposite site of the header pin. After removing this resistor and replacing it with a 22 Ohm, we can cut the trace using a knife and connect a wire on the MCU side of the resistor. While doing this, I also repurposed the SWI pin (used for STM8 chips as well) to get the SWO debug output. For that, I connected the GPIO PA10 located on pin number 31, also through a 22 Ohm resistor.
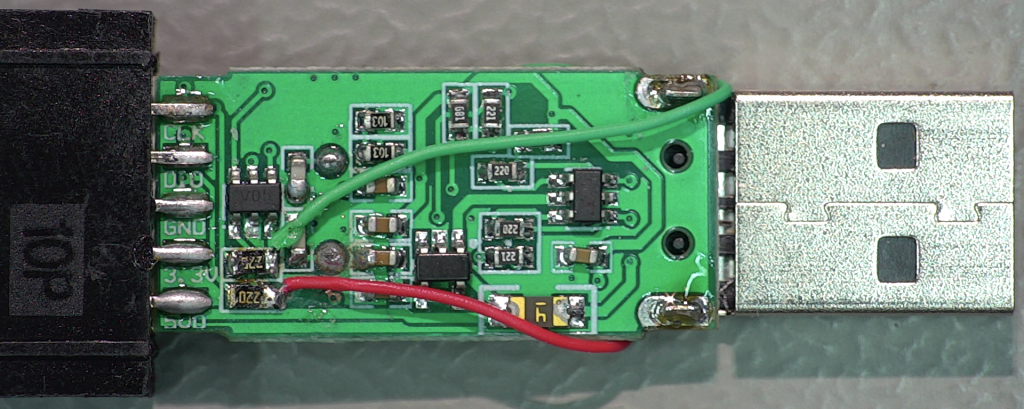
Once we have the two wires connected, we can bring them on the other side of the board to connect them on the corresponding pins of the MCU :

Testing
Using the ST-Link utility, it is possible to select the connect under reset feature, click connect, and…

This is quite nice and all, but the ST-Link utility is a Windows-only tool. On GNU/Linux, the mostly used software is OpenOCD. The connect on reset feature is also supported by using the reset_config directive in the configuration file.
source [find interface/stlink.cfg]
transport select hla_swd
reset_config srst_nogate connect_assert_srst

source [find target/stm32l0.cfg]

$_TARGETNAME configure -event gdb-attach {
    reset halt
}
Running openOCD with this configuration allows to access the MCU and program it, mission complete !

I’m trying to use this article. I’m connected to an ST-Link V3 over Visual Studio on open ocd. then I connect to localhost 4444 over telnet, I enter the commands but nothing comes from the trace. Any idea what I am doing wrong?