


Industrial control systems (ICS) made the headlines a few times lately due to their importance in critical infrastructures (power plants, oil, gas, nuclear plants, etc.)
ICS is a portmanteau for defining the entire cohorts of systems and software used to monitor, collect and administer industrial systems. Here is the definition of ICS by the NIST’s Guide to Industrial Control Systems (ICS) Security:
Industrial control system (ICS) is a general term that encompasses several types of control systems, including supervisory control and data acquisition (SCADA) systems, distributed control systems (DCS), and other control system configurations such as Programmable Logic Controllers (PLC) often found in the industrial sectors and critical infrastructures.
There exist plenty of different protocols and specific hardware used in the ICS ecosystem, ranging from open source protocols to proprietary frameworks. Those systems (and their accesses) should not be directly exposed on the Internet but rather protected behind layers of firewalls. Unfortunately that is not always the case, as we have been able to discover many of them facing the Internet directly.
To get an overview of the availability of ICS devices in today’s networks, we selected the most represented protocols and probed the entire IPv4 address space to identify how many of those systems were actually openly reachable.
- BACnet (Building Automation and Control network) is a communication protocol used by building automation and control systems
- Fox is a communication protocols most commonly used in building automation systems
- Modbus is a communication protocol used by programmable logic controllers (PLC)
- MQTT (Message Queue Telemetry Transport) is a publish-subscribe-based message protocol
- MQTT over SSL (for convenience abbreviated mqtts below)
Below are the number of reachable services we found for each of the above protocols. Scanning for ICS is not new and other entities are also scanning for ICS services: shodan, scan.io and censys.io.
- fox: 27k
- mqtt: 27k
- modbus: 23k
- bacnet: 16k
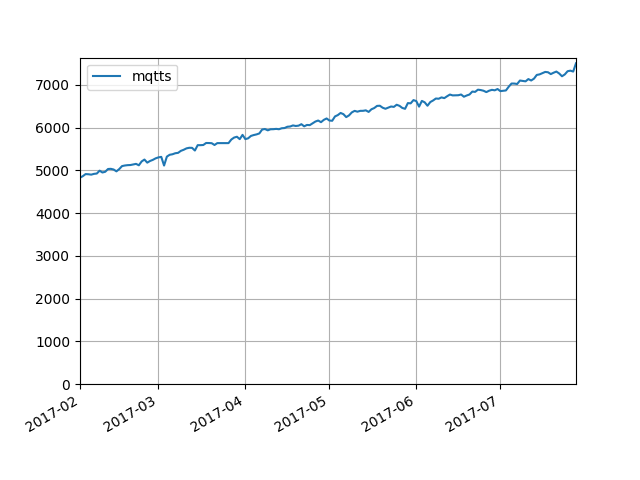
- mqtts: 6k

It is interesting to see that mqtt and mqtts have considerably evolved over those six months while other protocols tend to be more stable. As an example, mqtts results have almost double since we started scanning.
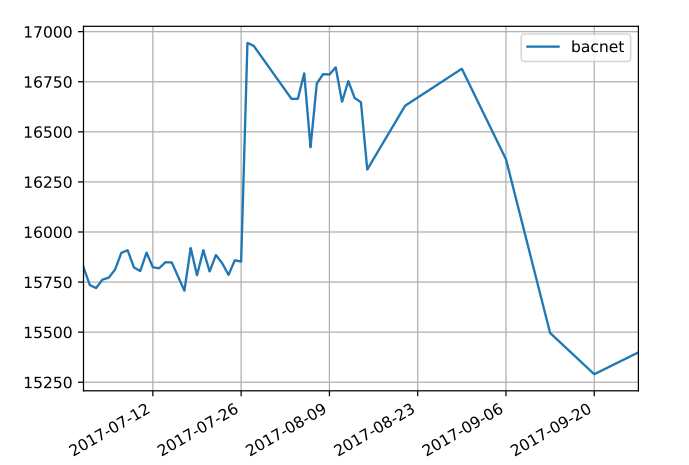
Also we can see a sharp increase in the bacnet results at the end of the graph. This section has been isolated in the following Figure. As seen on the graph, there seems to be an increase for a short period (about two weeks) and then a return to the normal. We have no definitive data to account for this increase, but this could be an ISP deploying new devices with available bacnet services, a manufacturer setting up new boxes, a firmware update opening access to previously firewalled services on multiple IPs, or even honeypots services.
Method
We scan the entire IPv4 address space for ICS systems on a daily basis. This allows us to get a good approximation of the number of devices currently available (and thus vulnerable) on the Internet. In order to validate that the running service is indeed the one expected on a specific port, we send a valid payload that should trigger a response. If the expected valid response comes back, we can confirm that the probed service is indeed running on the remote host. The payloads we use are all harmless.
We used scannerl in order to easily implement the fingerprinting modules and also distribute the fingerprinting nodes across a cluster. This allowed us to rapidly get results while reducing the likelihood our scans would be blocked (because we use multiple probes for each protocol). For more info on scannerl, see the previous post Distributed Fingerprinting with Scannerl.
ICS owners and locations
One interesting element to analyze is the location where, and by whom, each of these protocols are actually being exposed. For example, Modbus is mostly used in Europe and Australia (with almost 14% being used in Spain alone) while BACnet is used in north America (almost 50%).
The below Figures and tables give an overview of the location of those services as well as the IP owners for the provided services.
Bacnet
The distribution of Bacnet in the world.
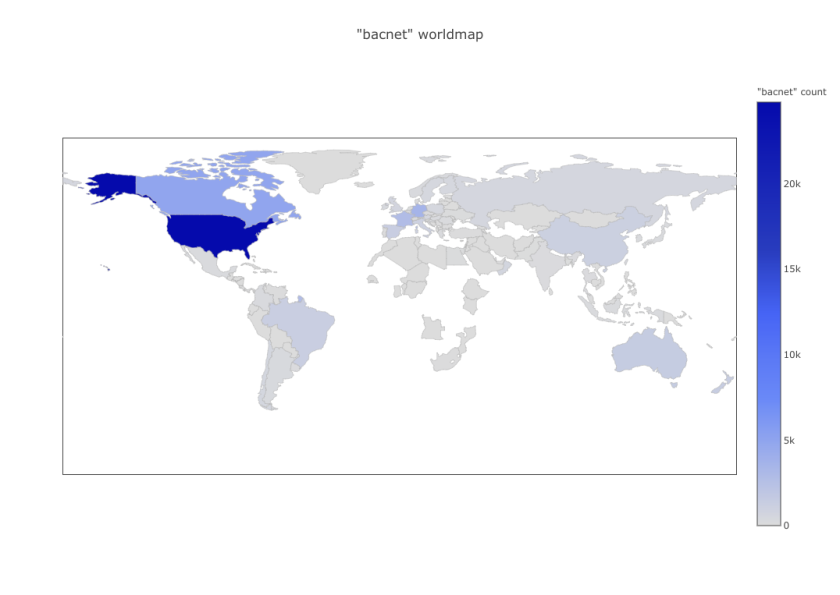
Top 10 Countries in percent of IPs for Bacnet
- 45.00% United States of America
- 8.88% Canada
- 6.52% Germany
- 5.14% France
- 2.67% Australia
- 2.48% New Zealand
- 2.41% Spain
- 2.30% Brazil
- 1.99% China
- 1.80% Italy
Top 10 IP owners in percent of IPs for Bacnet
- 8.87% Amazon.com Inc.
- 6.92% Amazon Technologies Inc.
- 6.17% Comcast Cable Communications LLC
- 3.01% Deutsche Telekom AG
- 2.09% Spark New Zealand Trading Ltd
- 1.95% Time Warner Cable Internet LLC
- 1.94% France Telecom S.A.
- 1.68% Telus Communications Inc.
- 1.63% Bell Canada
- 1.34% SFR SA
Fox
The distribution of Fox in the world.
Top 10 Countries in percent of IPs for Fox
- 31.17% United States of America
- 20.13% Italy
- 10.74% France
- 5.24% Australia
- 3.88% Canada
- 3.35% Mexico
- 2.58% Germany
- 2.44% Netherlands
- 2.26% United Kingdom
- 2.26% Austria
Top 10 IP owners in percent of IPs for Fox
- 12.25% Telecom Italia S.p.A.
- 7.02% Vodafone Italia S.p.A.
- 6.97% Bouygues Telecom SA
- 3.39% Verizon Wireless
- 2.67% Comcast Cable Communications LLC
- 2.66% Telstra
- 2.10% Telstra Internet
- 2.09% Orange S.A.
- 2.08% Uninet S.A. de C.V.
- 1.91% Deutsche Telekom AG
Modbus
The distribution of Modbus in the world.
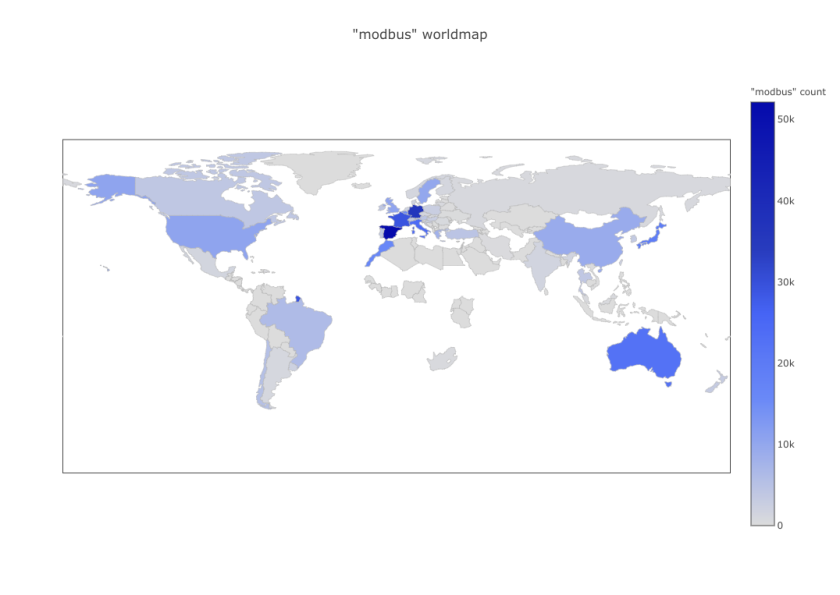
Top 10 Countries in percent of IPs for Modbus
- 14.72% Spain
- 10.26% Germany
- 8.24% France
- 6.81% Italy
- 6.37% Australia
- 5.50% Japan
- 4.61% Morocco
- 4.55% Belgium
- 2.97% United States of America
- 2.96% United Kingdom
Top 10 IP owners in percent of IPs for Modbus
- 11.67% Telefonica de Espana Sau
- 4.89% Deutsche Telekom AG
- 4.51% Telecom Italia S.p.A.
- 4.41% Telekom Deutschland GmbH
- 4.40% SFR SA
- 3.96% KDDI Corporation
- 3.85% Proximus NV
- 3.36% Maroc Telecom
- 3.28% Telstra
- 3.02% Telstra Internet
Mqtt
The distribution of Mqtt in the world.

Top 10 Countries in percent of IPs for Mqtt
- 17.80% Brazil
- 10.24% Singapore
- 10.08% Taiwan, Republic of China
- 9.22% Spain
- 8.10% China
- 7.73% Japan
- 6.30% Germany
- 4.40% Hong Kong, SAR China
- 4.26% United States of America
- 3.25% Morocco
Top 10 IP owners in percent of IPs for Mqtt
- 17.56% Vivo S.A.
- 8.69% Vodafone Espana S.A.U.
- 8.64% Chunghwa Telecom Co. Ltd.
- 6.11% NTT DoCoMo Inc.
- 4.86% StarHub Mobile
- 4.21% Singapore Telecom Mobile Pte Ltd
- 3.28% Deutsche Telekom AG
- 2.32% Maroc Telecom
- 2.05% MEO – Servicos de Comunicacoes e Multimedia S.A.
- 2.00% Smartone Mobile Communications Limited
Mqtt over SSL
The distribution of Mqtts in the world.
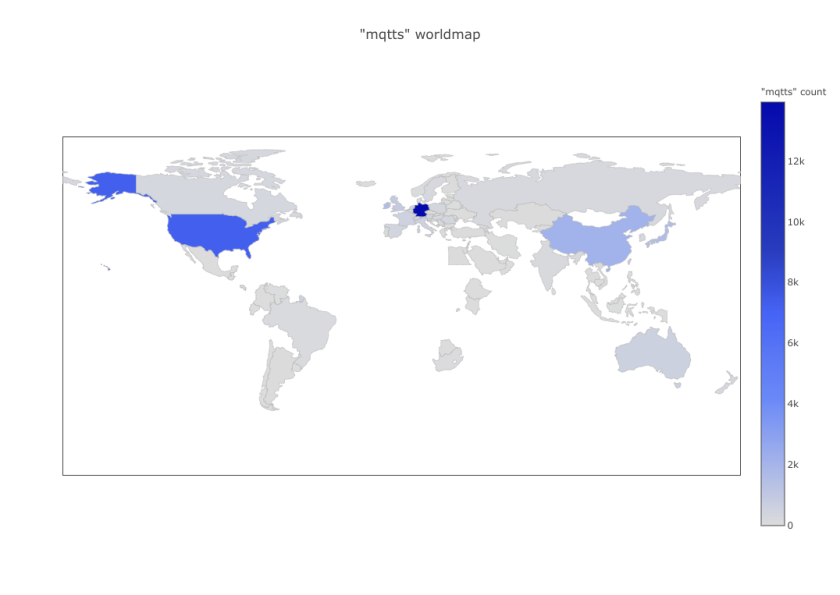
Top 10 Countries in percent of IPs for Mqtts
- 39.33% Germany
- 20.45% United States of America
- 6.04% China
- 4.45% Ireland
- 4.34% Japan
- 2.59% United Kingdom
- 1.94% Taiwan, Republic of China
- 1.78% Netherlands
- 1.63% Australia
- 1.59% France
Top 10 IP owners in percent of IPs for Mqtts
- 21.04% Deutsche Telekom AG
- 11.30% Amazon Technologies Inc.
- 3.82% Amazon.com Inc.
- 3.10% Telefonica Germany GmbH & Co. OHG
- 2.94% Aliyun Computing Co. Ltd
- 2.72% Amazon Data Services Ireland Limited
- 2.67% Telefonica Deutschland GmbH
- 2.15% Vodafone GmbH
- 1.95% Microsoft Corporation
- 1.74% Amazon Data Services Japan
IP analysis
Flipping rate
For the different protocols we scan, we have seen very few dangling IPs. Of course one has to count with network hazards but mostly IPs tends to be stable. We have analyzed the number of IPs that flip. By IP flipping we consider an IP that is present at scan N and disappears at scan N+1 (or the other way around). Counting the number of times an IP changes its state gives us the flipping rate.
The following list shows the percentage of IPs that have a flipping rate less than or equal to 20% (IPs that flip not more than one time every 5 scans).
- bacnet: 98.57%
- modbus: 98.81%
- fox: 98.67%
- mqtt: 99.84%
- mqtts: 99.66%
This allows us to validate that most of these IPs are indeed stable (they respond or they don’t but they don’t flip).
Protocol analysis
How many of those hosts are indeed running more than one of those protocols? Only a few percentage of IPs have more than one service available as shown below. Since these protocols are being run on very specific systems, we suspect that a proportion of this small percentage might be honeypots.
- one ICS protocol per IP: 95.5 %
- more than one protocol per IP: 4.5 %
Independent of the protocol found, the USA is the biggest player in the ICS world followed by Spain. The following list shows the top 10 Countries in percent for all protocols.
- 10.19% United States
- 8.84% Spain
- 8.04% Brazil
- 7.79% Germany
- 5.69% Japan
- 4.78% Taiwan, Province of China
- 4.75% Singapore
- 4.63% China
- 4.12% Italy
- 4.09% France
References
- NIST Guide to Industrial Control Systems (ICS) Security
- https://securelist.com/analysis/publications/75343/industrial-cybersecurity-threat-landscape/
- https://ics-radar.shodan.io/
- https://www.shodan.io/explore/category/industrial-control-systems
- http://scadastrangelove.blogspot.com/
