
Scanning of services and ports on the Internet has been an area of focus of the Applied Research Team at Kudelski Security for the last few years. This article gives a brief introduction to our previous work and an insight on the current state of the Internet by showcasing interesting findings on certain protocols.
Background
There are two types of scanning: port scanning and fingerprinting. Port scanning refers to the technique of sending a packet to an IP address with a specific destination port number to test if the port is opened, closed, or filtered. An open port might mean that an application is using it. To gain more information, a fingerprinting scan is then performed on this specific port. Depending on the application, information such as software version, distributor, commands accepted, or security protocols can be gathered. However, knowledge of the application is necessary to craft appropriate packets.
As you can imagine, scanning the 2^32 ~ 4.3 billion IP addresses requires adequate software and infrastructure. For this purpose, many tools were developed internally and open-source solutions such as Apache Hadoop, HDFS, Hive, and Spark were configured on a powerful cluster.
7Port scanning was performed using one of the most popular scanning tools: zmap. According to the authors and our internal tests, it is capable of scanning the full IPv4 range in less than 45 minutes using a gigabit connection.
However, fingerprinting involves sending multiple packets depending on the application and the transport layer it is using. This increase in complexity led us to develop scannerl, a distributed fingerprinting engine which was open-sourced last year on our Github page. An introduction to scannerl can be found in a previous blog post. Scannerl’s modularity allows us to quickly develop modules in order to fingerprint specific protocols. Multiple articles were written, for example, this post gives a walk-through on the implementation of a module to fingerprint MySQL and get its version.
A previous article published in October 2017 describes the results of scanning Industrial Control Systems (ICS) protocols such as BACnet, Modbus, or MQTT and can be found here. The results concerned six months between February and August 2017 on five ICS protocols. Since then, scanning continued and more and more protocols were included each month.
Before we start providing results, we want to make a few points.
Scanning at the Internet scale is hard:
-
It requires a lot of bandwidth, processing power, and storage capabilities. A scan might contain incomplete results because a scannerl slave crashed due to resource exhaustion for example.
-
Scanning involves dozens of virtual machines on shared infrastructure which are created and destroyed on-the-fly.
-
Fingerprinting requires sending multiple packets, each which can get lost, time out, etc. to millions of hosts.
Results might not be accurate for the following reasons:
-
Hosts might not answer because they might be temporarily down.
-
IP owners might have blacklisted us.
-
As we honor our blacklist, certain networks have not been scanned. To be precise, 6’861’752 IP addresses are not scanned as their owners asked us not to.
Therefore, other sources such as shodan.io or censys.io might provide different results.
Results
As of the writing of this blog post, we are performing many different scans. Recall that a fingerprinting scan implies performing a port scan previously. Therefore, most of those scans are performed on the same port and transport layer protocol twice, one for each type of scan. This is not the case for the ICMP Ping scan which simply sends an echo request and expects an echo reply in return as it operates on the network layer.
The first analysis performed here relates to ICMP Ping. This scan has the most chance of receiving an answer from hosts directly connected on the Internet as it is a widely available tool for network debugging.
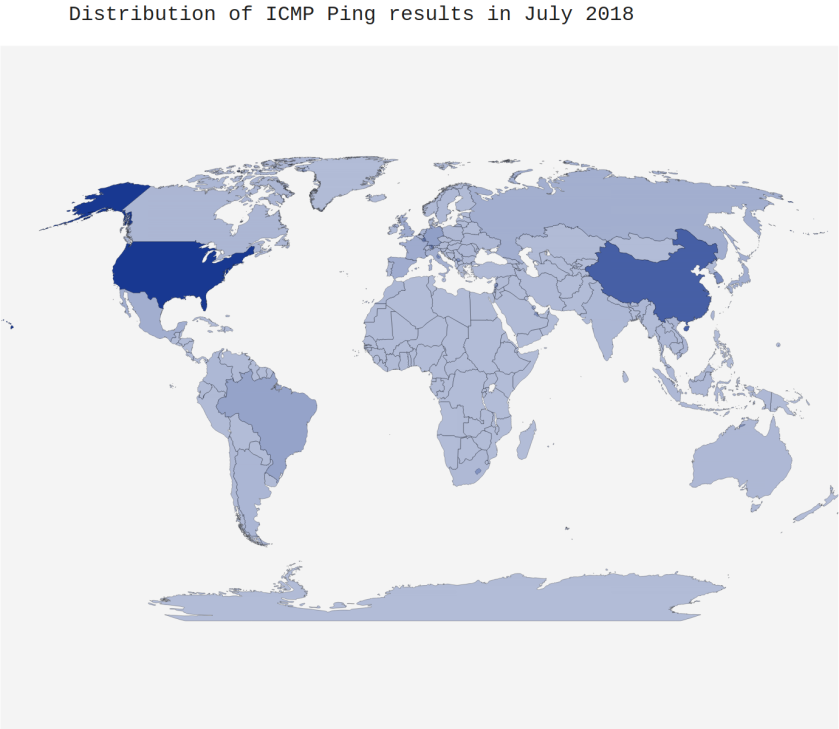
We ran this scan monthly since March 2017 and the last scan was executed on the 16th of July. At this date, we saw over 344 million IP addresses answering to our echo request. However, on average since we started, 365 million hosts are responding to ping. Using MaxMind’s GeoIP database, we enrich the IP addresses from our scan with geographical information such as longitude, latitude, country name, city name, or ASN (Autonomous System Number).
On Figure 1, we see the five countries with the most IP addresses and Switzerland and their evolution over time.
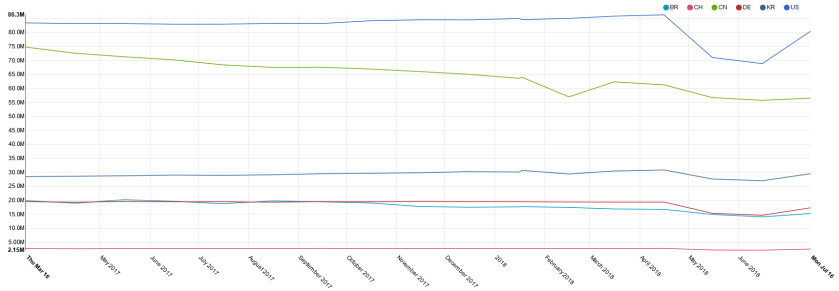
As can be expected, the country with the most hosts is the USA with 82.4 million IP on average. Except the drop in May and June 2018, the results are quite constant. We investigated the drop and it seems to affect most of the countries and ASNs with the most results which may indicate issues on our side during those scans.
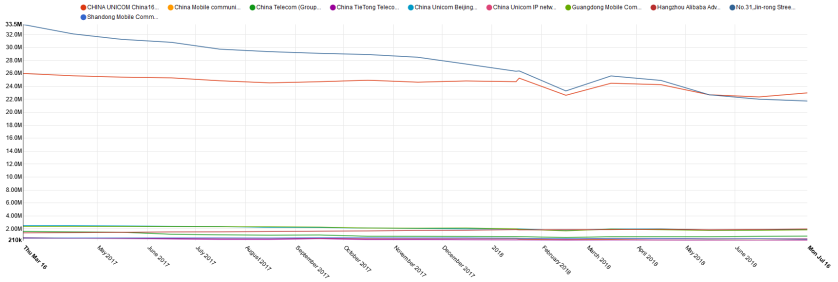
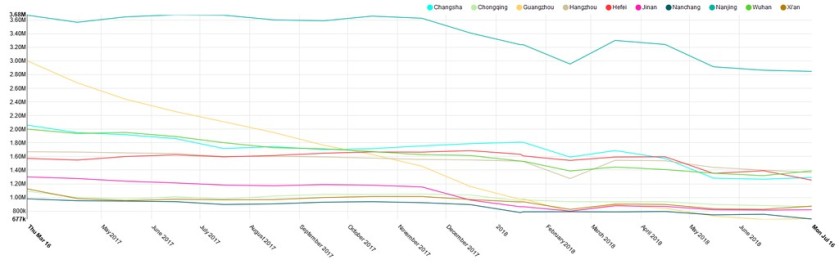
The second country is China with 64.9 million results on average. We noticed a downward trend, starting with 74.8 million in March 2017 and ending with 56.5 million in July 2018. We dug deeper by analyzing by ASN (see Appendix 1.) and immediately noticed that the two top Autonomous Systems are mainly responsible of this drop. ASN 4134 drops from 33.5 to 21.7 million in 17 months while ASN 4837 “only” losses 3 million. In Appendix 2., we looked how the number of hosts changes in the top 10 Chinese cities in ASN 4134. The most interesting change is for Guangzhou, a city of 14.5 million inhabitants: in March 2017, 3 million IPs answered to ping while in July 2018, only 690 thousand are left. The decline can be seen for the other top 9 cities, however not as significant. The reason behind this change is unknown, any input would be greatly appreciated.
The third country with the most hosts answering to ICMP Ping scans are South Korea with a steady 29.3 million results. Battling for the fourth place are Germany and Brazil, the former is winning since November 2017. Both have on average 18.8 and 17.9 million hosts respectively.
Unsurprisingly, Switzerland only has 2.6 million IPs responding to our scans on average. In Table 1, we can see the top 5 Swiss towns with the most hosts answering. This top 5 contains the same towns as the 5 Swiss towns with the most inhabitants.
|
City |
Average number of results |
|
Zurich |
226’232 |
|
Geneva |
92’956 |
|
Lausanne |
63’015 |
|
Bern |
61’840 |
|
Basel |
59’208 |
Table 1. Top 5 Swiss towns with the most ICMP Ping scan results averaged.
However, over 428 thousand addresses are not registered to any towns in the MaxMind GeoIP database.
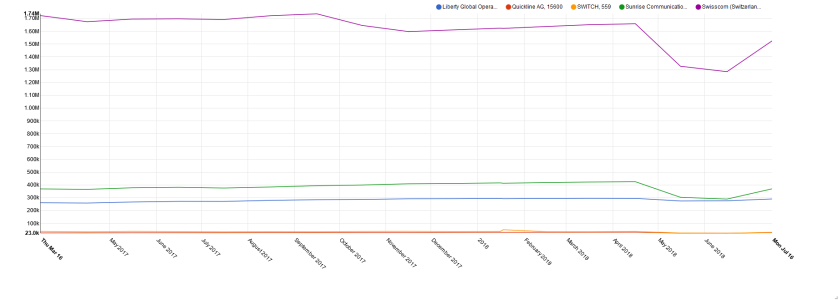
Swisscom is the ASN with the most hosts answering to ping. According to Swisscom’s annual report, there are 2.449 million broadband access lines. Looking at certain of those IP addresses, it is supposed that most of their home routers answers to ping which is not the case for other ISPs.
The next ASNs are Sunrise and Liberty Global Operations, the parent company of UPC which have, respectively, 422 and 749 thousand private Internet customers.
|
ASN |
Average number of results |
|
Swisscom (Switzerland) Ltd (AS3303) |
1’621’525 |
|
Sunrise Communications AG (AS6730) |
385’072 |
|
Liberty Global Operations B.V. (AS6830) |
282’491 |
|
SWITCH (AS559) |
35’247 |
|
Quickline AG (AS15600) |
27’724 |
Table 2. Top 5 Swiss ASNs with the most ICMP Ping scan results averaged.
Conclusion
In this article, we introduced our results on one of our periodic scans: ICMP Ping. We started with this scan as we thought it would return the most results. Several interesting findings have been made, however, finding a correct explanation for those can be hard.
Appendix